Making Your QMS Understandable to All by Using Graphics

A picture is worth a thousand words. This is also true for your Quality Management System.
Traditional software, databases and spreadsheets make your quality system hard to understand for end users. A reason for this, typical tools contain no graphics, process maps or visual flows.
Moving to a visual QMS will drastically help employees to understand how your company works.
We bring the most flexible solutions for quality and data privacy compliance, thanks to our no-code app building platform and Microsoft technologies. Power users can simply add their favorite images, maps, process flows in BPA with no pain.
Here are some examples to make your QMS understandable to all, by using graphics.
Process map and sub processes
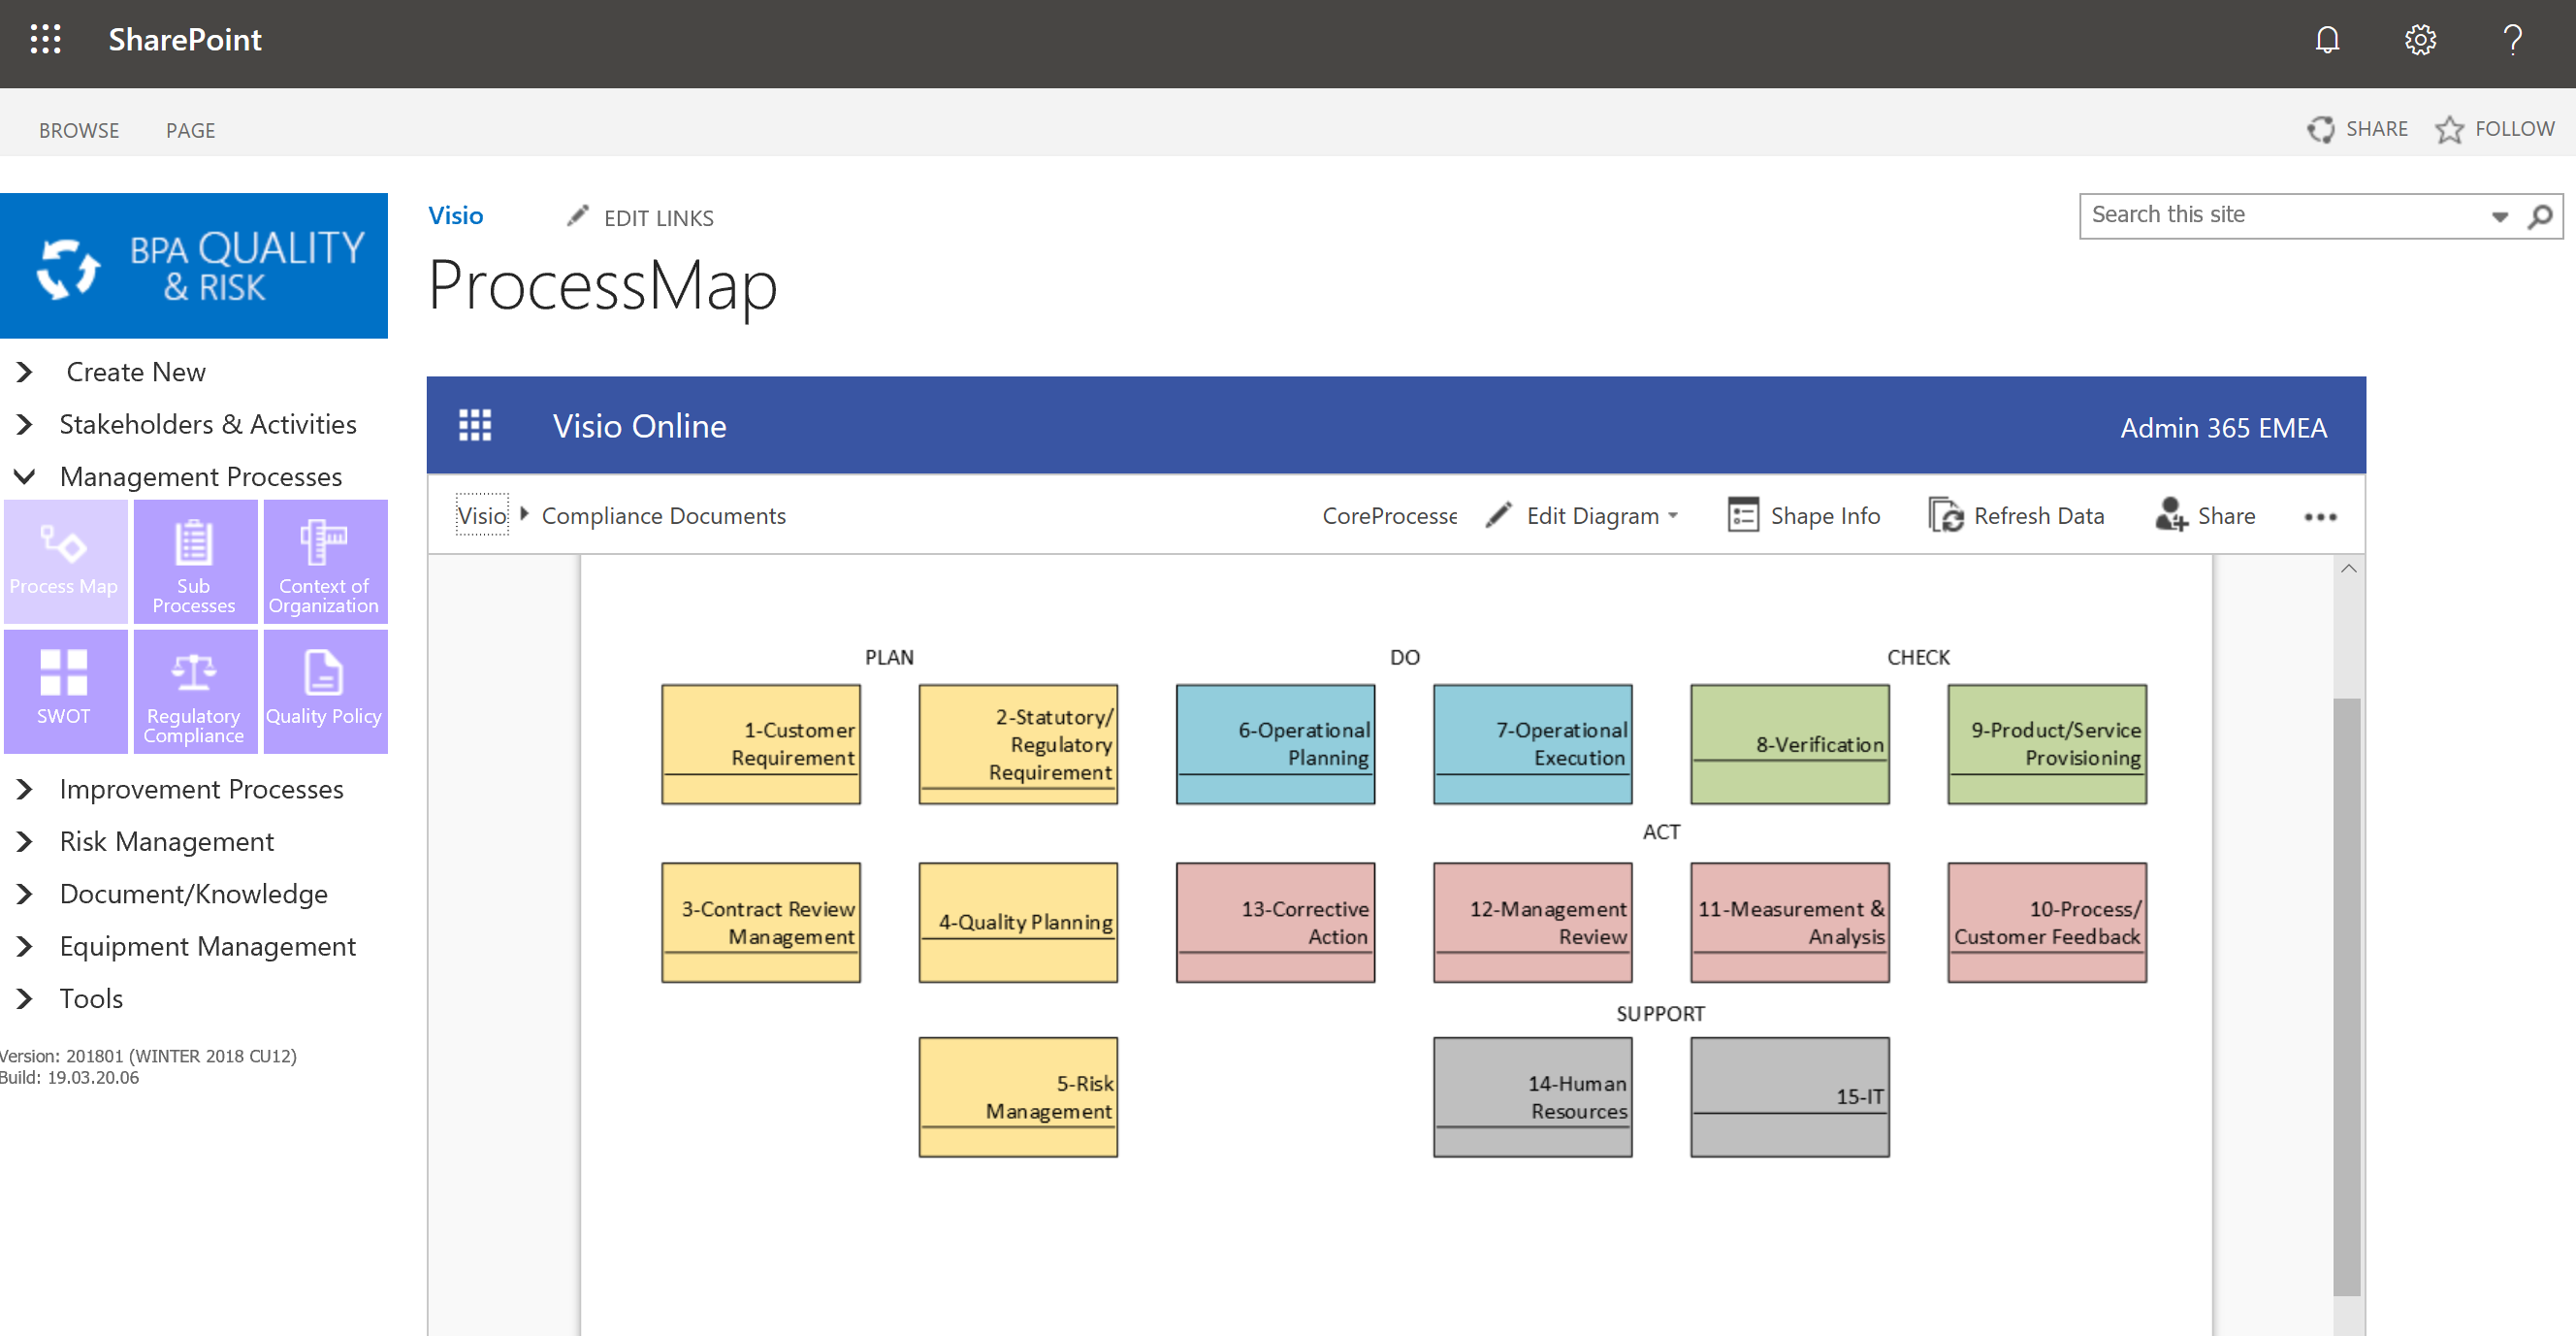
A graphical process map is the entry door in your QMS and should contain all important value-added processes from client request to client satisfaction.

By using Microsoft Visio diagrams, you can design interactive maps with hyperlinks and dynamic icons (e.g. process health status). Visio diagrams can be connected to objects and attributes in BPA, like a list of processes, sub processes or assets.
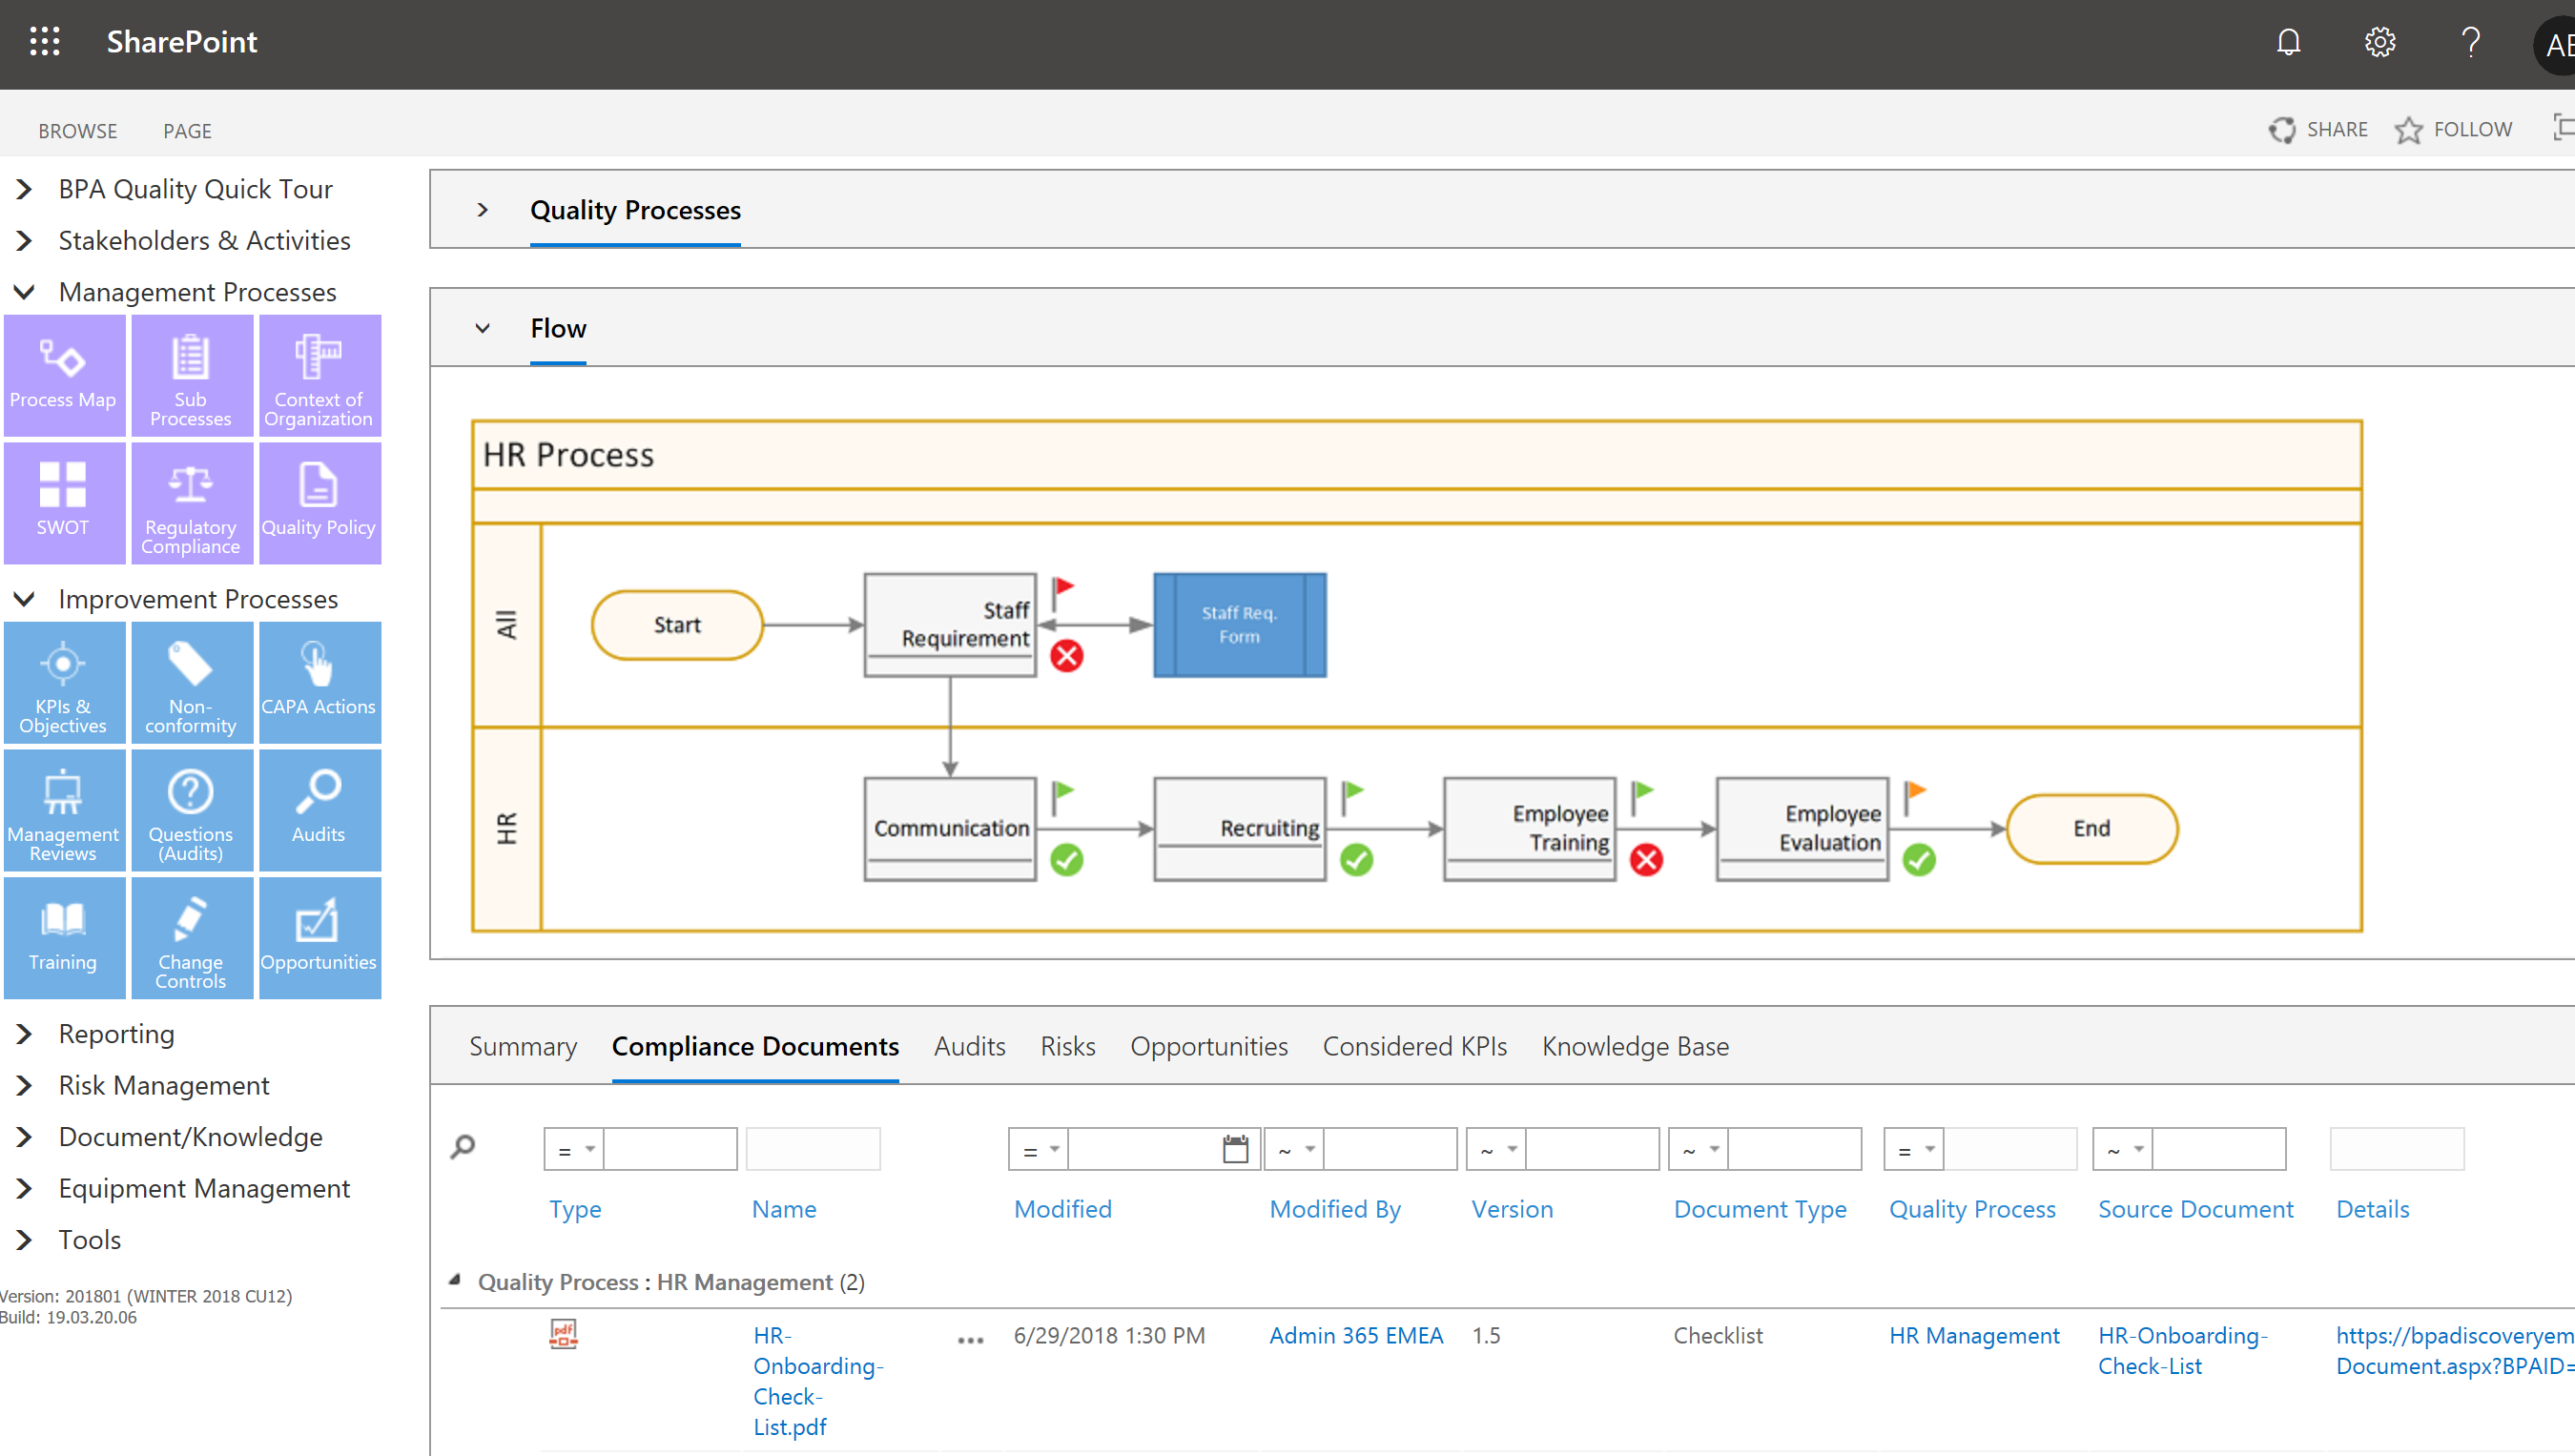
By drilling down the process map, graphical flows make each process understandable with their main activities, input and output. Employees can quickly access process-related documents, SOPs and Work Instructions.

Asset Maps
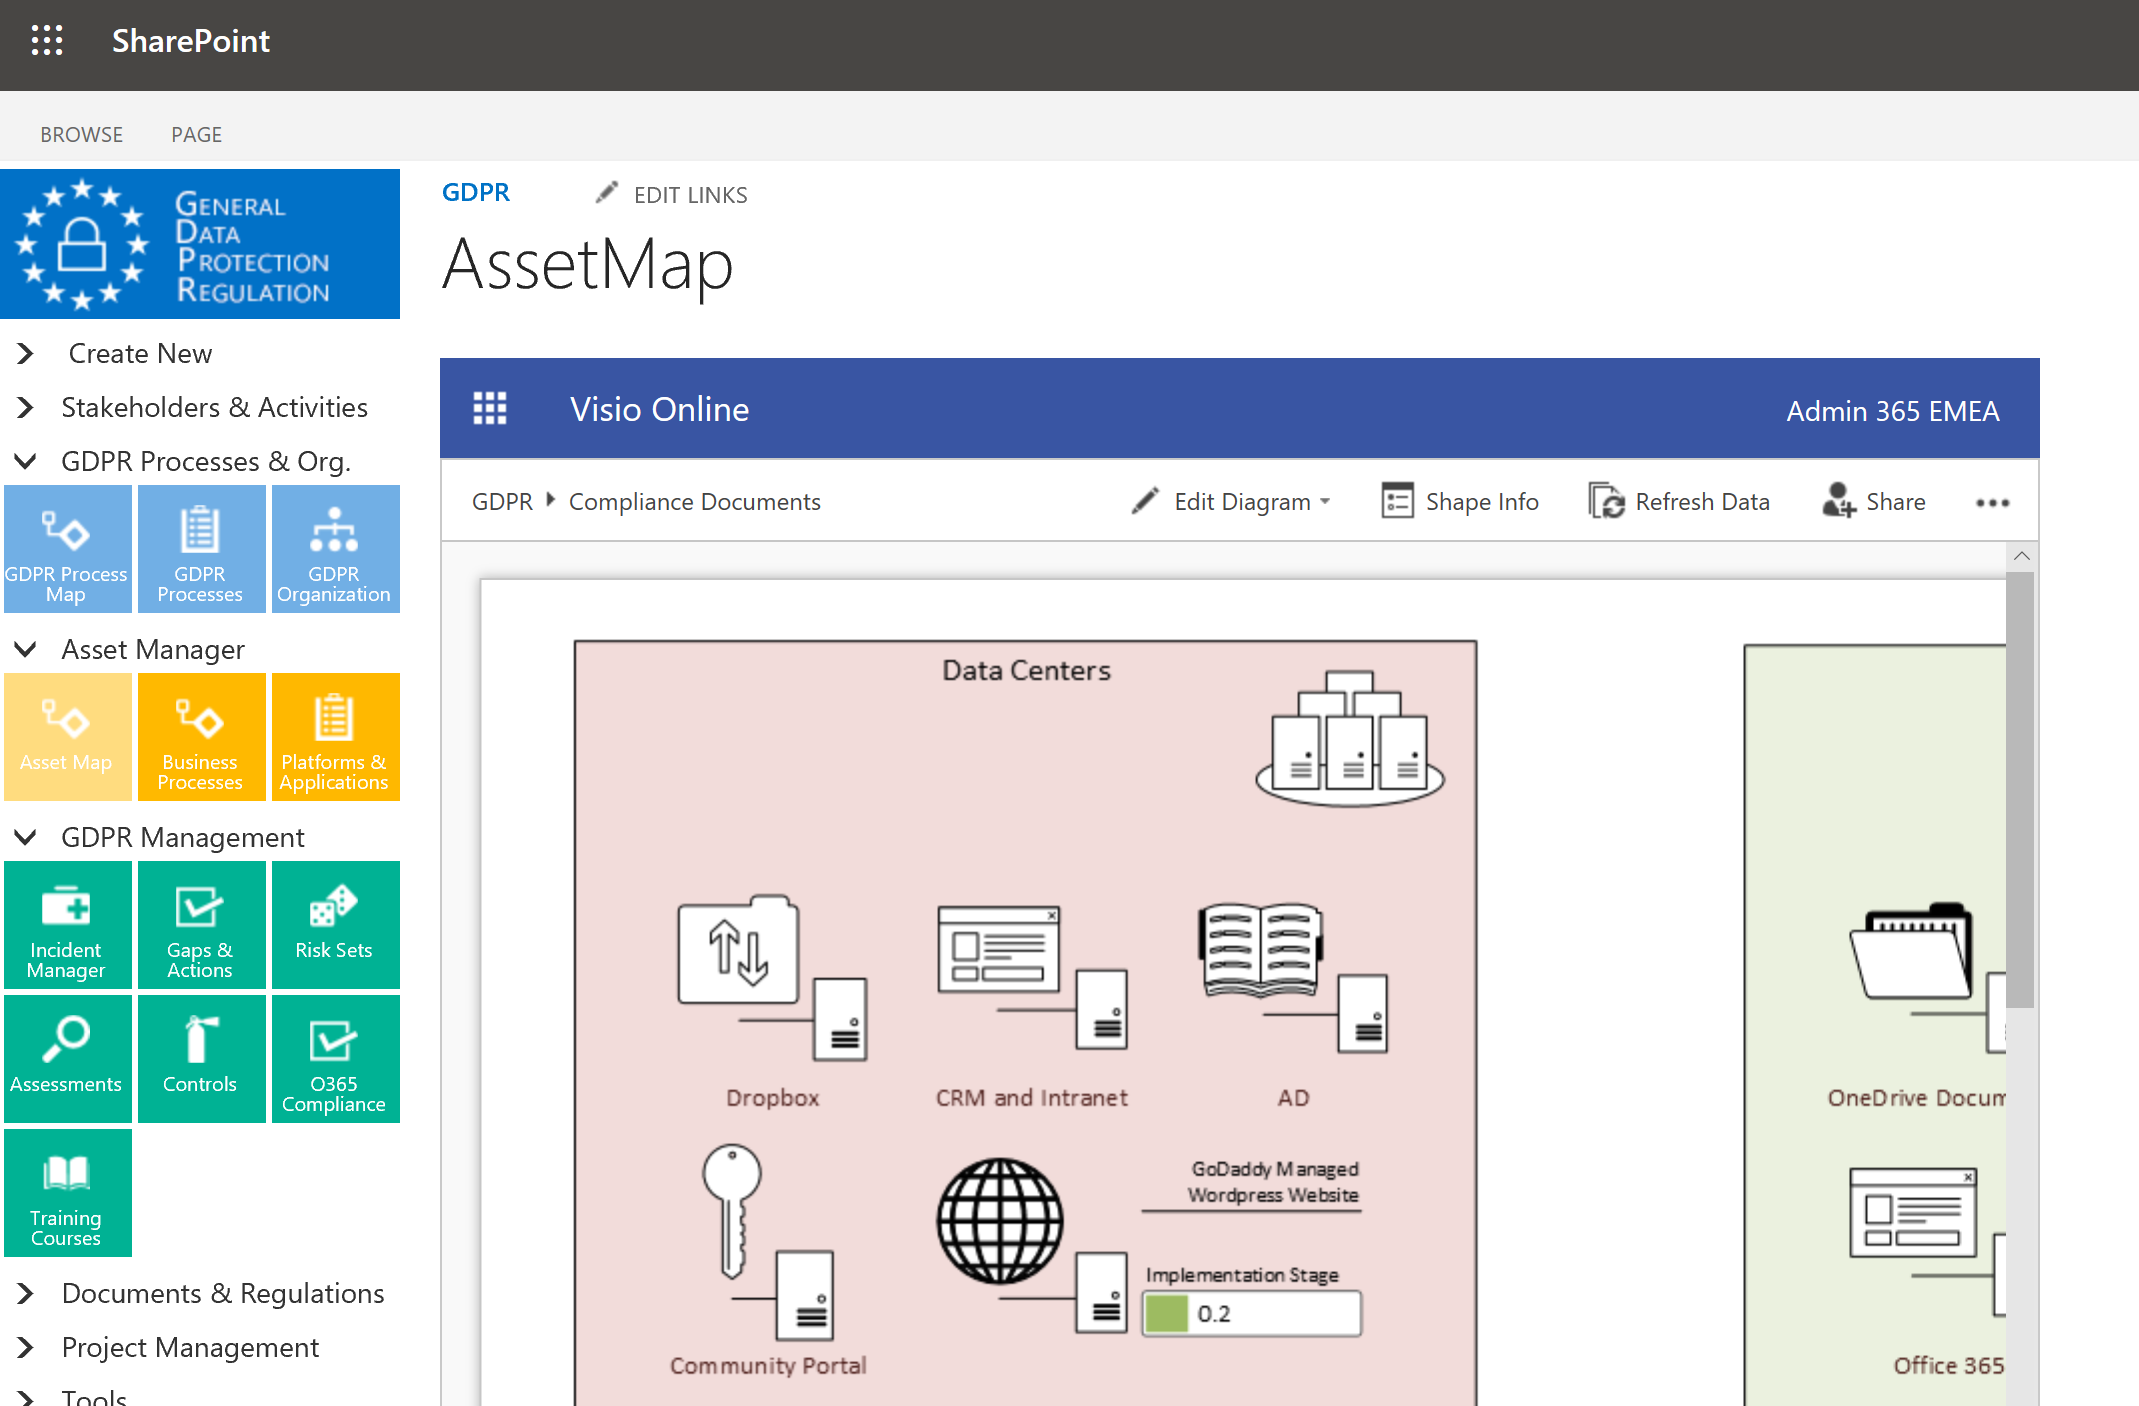
BPA lets you track digital or physical assets, like data assets (needed for ISO 27001, GDPR, data privacy regulations) or equipment with related maintenance and calibration.
In this example, the graphical asset register displays the implementation stage status for asset platforms with regards to GDPR regulations.

Organization Charts
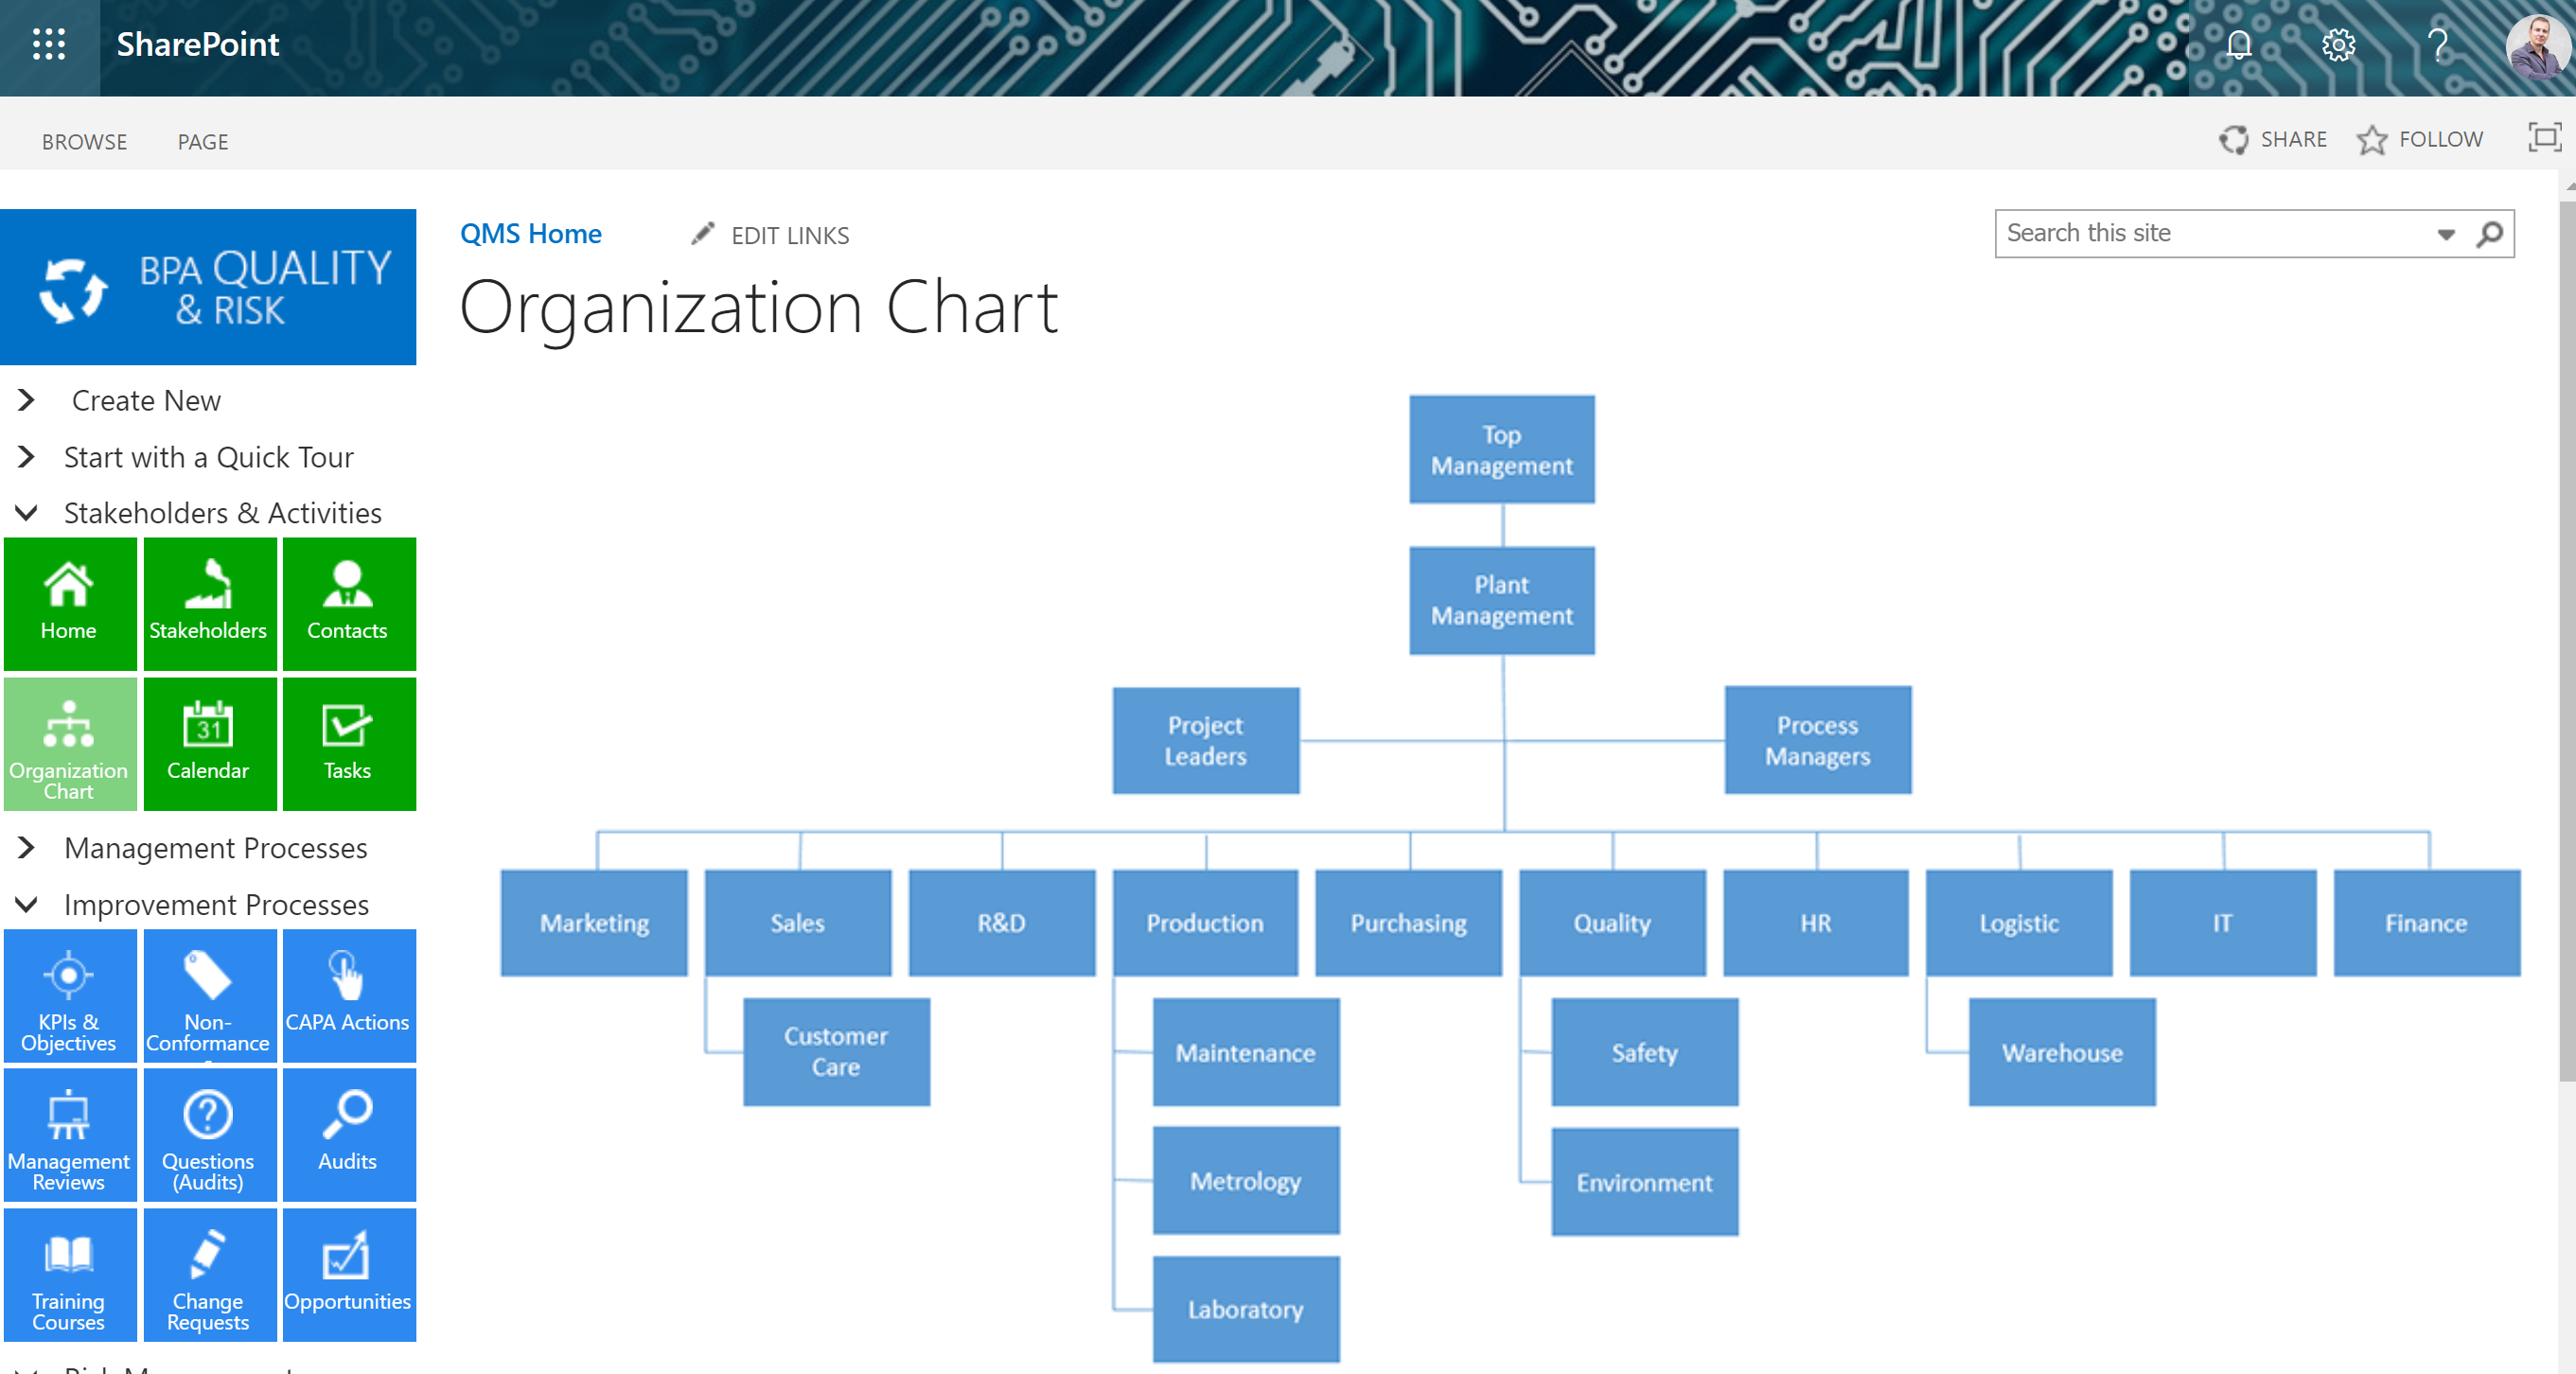
Organization charts (one or multiple organizational levels) is another way for employees to access processes, sub processes and compliance documents.

Ask us for an online presentation and discover new ways to make your QMS attractive by using graphics.


